

Geomagnetism: A modern tool for space weather forecasting and rapid response to associated natural hazards, ensuring the protection of critical infrastructure and national air traffic safety.
Project code: PN 23-39-04-01
Project manager: Dr. Ing. Laurențiu Asimopolos
Description
The project primarily aims to intelligently leverage advanced scientific findings—derived from modern storage and mathematical analysis techniques applied to an archive spanning nearly 80 years of long-term geomagnetic data, as well as key parameters of geomagnetic activity and declination processed in real-time at the Surlari National Geomagnetic Observatory. Correlating this geomagnetic data with solar emission cycles and variations, the spatiotemporal evolution of solar wind composition, density, and velocity, and ionospheric effects will provide a tool for forecasting climate change and space weather, as well as for rapidly quantifying the potential impacts of extreme geomagnetic storms at mid-latitudes. Secondly, the periodic updating of absolute declination values within the Airport Secular Variation Network—using global models, national reference values derived from observatory records, and in-situ measurements—will reveal the real-time dynamics of declination anomalies nationwide and serve as a modern risk-mitigation tool in a strategic sector: national air traffic safety. Thus, geomagnetism can function as a rapid-response tool for quantifying the effects of space weather on the essential technological systems required to sustain the socio-economic and security standards of modern society.
Objectives
- leveraging the geomagnetic database—spanning nearly 80 years—to address current needs: space weather forecasting and quantifying effects on quality of life in modern society
- advanced research into the spatiotemporal dynamics of the geomagnetic field in relation to heliospheric sources, using statistical methods and multiresolution analysis techniques—particularly spectral ones based on the wavelet transform;
- assessment of hazards generated by space climate and weather and of the risk of extreme geomagnetic storms;
- advanced and comparative analyses of geomagnetic storms recorded simultaneously at INTERMAGNET observatories, including the Surlari Geomagnetic Observatory.
- development of models for the diagnosis and prediction of geomagnetic storms;
- fundamental and exploratory research using modern methods—where evaluation criteria are based on scientific excellence—aimed at integrating fundamental research components into applied studies focused on the strategic field of air traffic safety.
- fostering dialogue between science and society through the design and development of a web platform featuring complex, multidisciplinary interactive services, utilizing “Cloud-in-a-Box” information and communication technologies.
Results PN_23_39_04_01.pdf
- Web GIS application – a highly complex service based on an open-source content management system and supporting the encrypted HTTPS protocol.
- A system updated annually, featuring a dedicated e-learning component for organizations concerned with air traffic safety (an ArcGIS application utilizing specific modeling techniques for the spatio-temporal prediction of magnetic declination values from the Airport Variation Network).
The Web-GIS application was developed using the IGR’s ArcGIS Server and can be viewed in a web browser at the following address: http://harti.igr.ro/masuratori_aeroporturi . Figure 1 shows the thematic layers in the application at the national level.
Fig. 1 Web-GIS application regarding magnetic declination measurements performed by ONGS between 2010 and 2024.
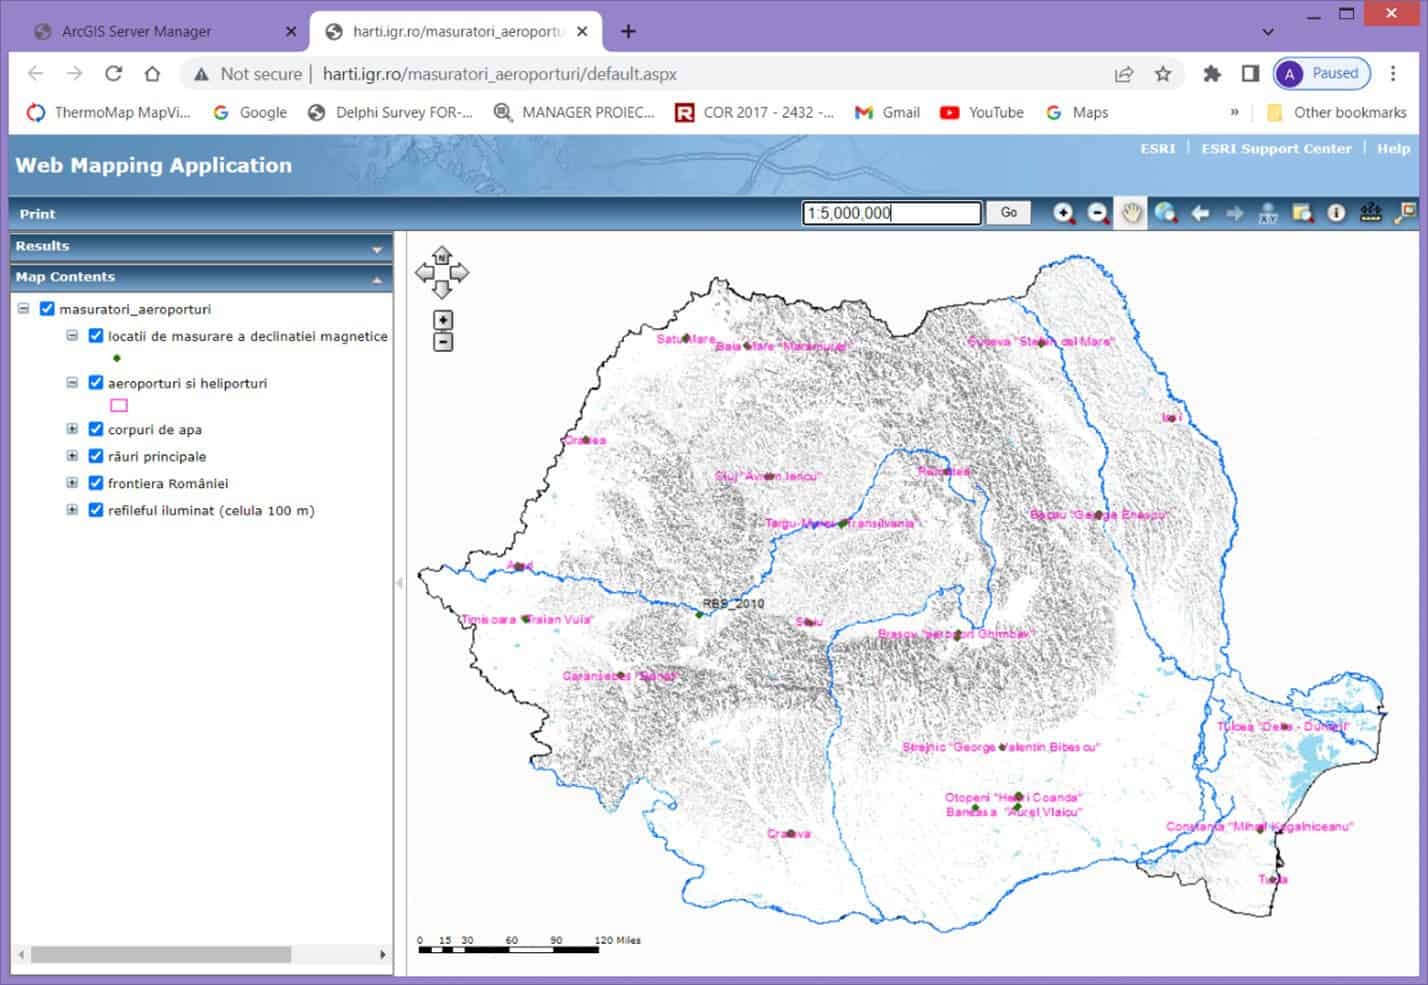
To this end, databases containing polygons representing airports, heliports, and radio beacons—for which the institute had conducted geomagnetic measurements essential for flight safety—were downloaded by county from the ANCPI portal’s “TopRO50 Download” section. The aim was to use GIS databases standardized for Romania in accordance with the INSPIRE Directive, with the ultimate goal of creating a GIS application based on accurate, nationally approved data. The address of Romania’s INIS download portal is:https://geoportal.gov.ro/arcgis/apps/sites/#/inspire/
All selected polygons were imported as feature classes into a file geodatabase (.gdb). In cases where the ANCPI databases did not include newer airports (such as the one at Ghimbav, near Brașov, which became operational in 2022), the outlines were traced using Google Earth imagery.
- Consolidation and standardization of geomagnetic data in digital format covering seven solar cycles (1943–2023). Setup of databases containing time series of geomagnetic data and geomagnetic activity indices, designed for subsequent periodic updates; consolidation and periodic updating of global geomagnetic activity indices, as well as ionospheric and heliospheric data relevant to the solar wind–Earth’s magnetosphere–ionosphere interaction.
The geomagnetic databases from the observatory’s archive have been standardized and configured: BD_YearMean (H,D,Z,X,Y,F1958_2006.dat), BD_HourMean (H,D,Z,X,Y,F1958_2006.dat), and BD_MinuteMean (H,D,X,Y,Z,F1999_2022.dat).
Databases were configured using the following global geomagnetic, ionospheric, and heliospheric activity parameters: BD_KP (annual files of the type 1932…2023KP), BD_AE-AP (1932…2023AP.dat, 1957…2011AE.dat), BD_DST (1957…2016DEF-DST.dat, 2017…2021PROV-DST.dat, 2023RAW-DST.dat), and BD_SUN (2004…2023F10.7.dat, 1932…2023QDDAYS.dat, 1923…2023SSN.dat).
The databases are periodically updated and will serve as key parameters in subsequent experiments. Thus, the Dst geomagnetic index—and its correlation with other geomagnetic indices possessing longer data series (such as Ap and Kp)—can aid in reconstructing the external geomagnetic field and major geomagnetic storms across each solar cycle, facilitating investigations in later phases into the potential link between the Sun (space weather) and Earth’s climate.
- Statistical-spectral and wavelet analyses of geomagnetic storms
To illustrate this, we present the spectral and wavelet analysis of data recorded at OGNS on April 23, 2023. The top section of the figure displays time-series plots consisting of 2,880 samples (at one-minute intervals) from April 23–24.
In the central part are the wavelet coefficients, using the Morlet function, level 5. At the bottom of each figure 2 and 3 are the wavelet analyses, where the abscissa corresponds to time (2880 minutes), the ordinate corresponds to the frequency and the color corresponds to the intensity of the field at each frequency and each minute (yellow – maximum intensity, blue – minimum intensity).
Fig. 2 – Multispectral wavelet analysis for the North geomagnetic component (Hx).
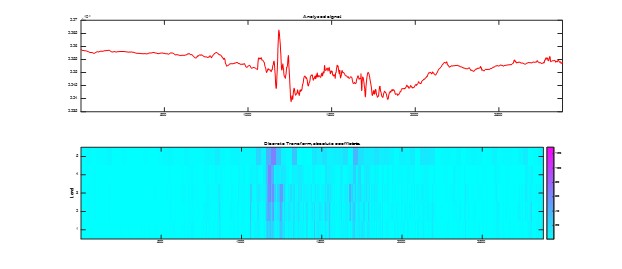
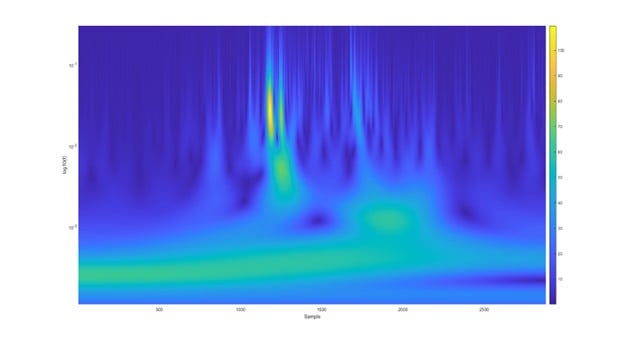
Figure 3 shows the wavelet coherence for the two horizontal components.
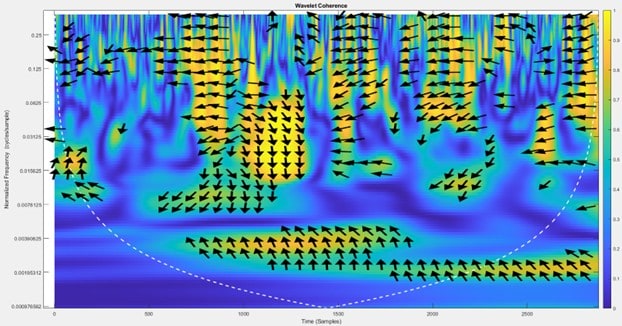
Fig. 3 – Wavelet coherence between Hx and Hy
- Conducting advanced and comparative analyses of geomagnetic storms recorded simultaneously at INTERMAGNET observatories, including the Surlari Geomagnetic Observatory.
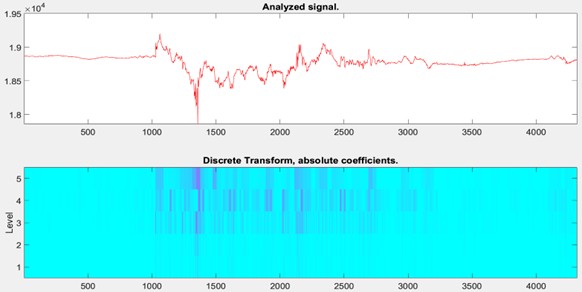
We illustrate the analysis comparing two observatories—one in Romania (Surlari) and one in Germany (Niemek)—during the storm of May 10–12, 2024, using spectral and wavelet methodologies in Figures 4 and 5. We analyzed data for the period of May 10–12, 2024, with a 1-minute sampling interval. In each of these graphs, the color coding is as follows: red represents the magnetic field in the North (X) direction; green represents the magnetic field in the East (Y) direction; blue represents the magnetic field in the vertical (Z) direction; and black represents the total magnetic field (F).
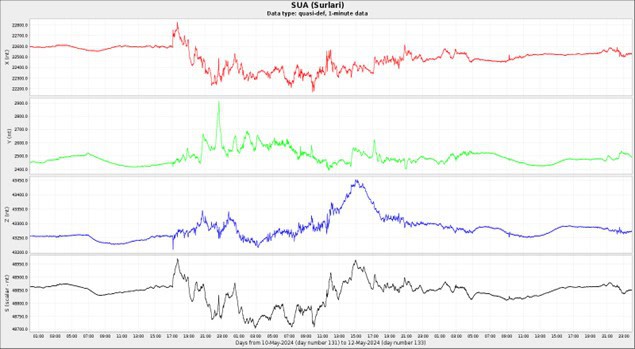
a) – magnetogram (May 10–12, 2024)
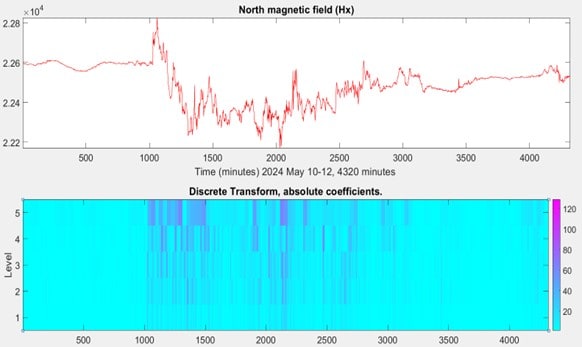
b) – Spectral analysis of the Hx component and wavelet coefficients (level 5)
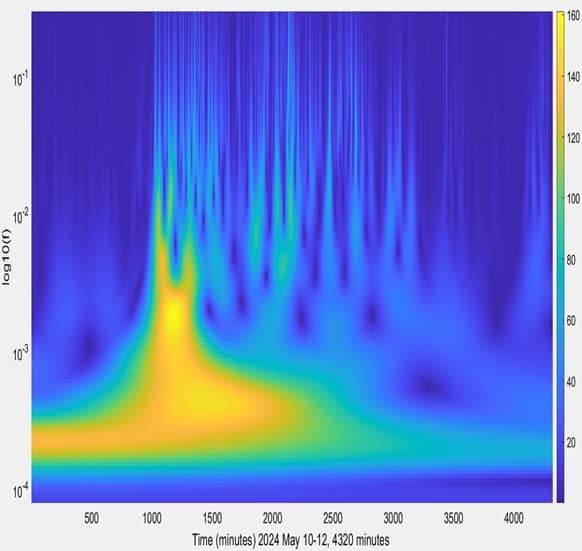
c) – Wavelet analysis of the Hx component (time-frequency-intensity) Figure 4 a, b, c – Surlari Observatory (SUA)
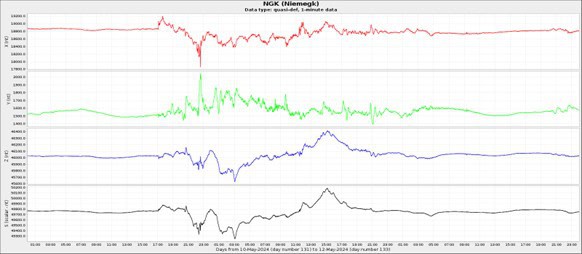
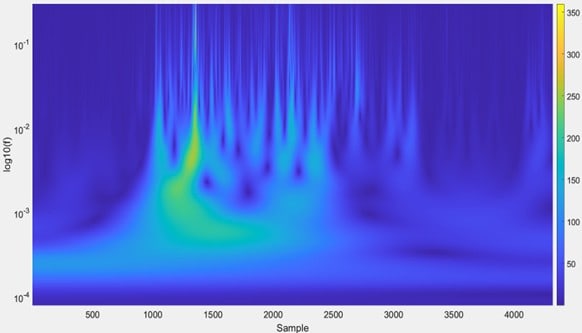
- Figure 5 a,b,c – Niemegk Observatory (NGK); Hx magnetogram (May 10–12, 2024), spectral analysis of the Hx component and wavelet coefficients (level 5), wavelet analysis of the Hx component (time-frequency-intensity)
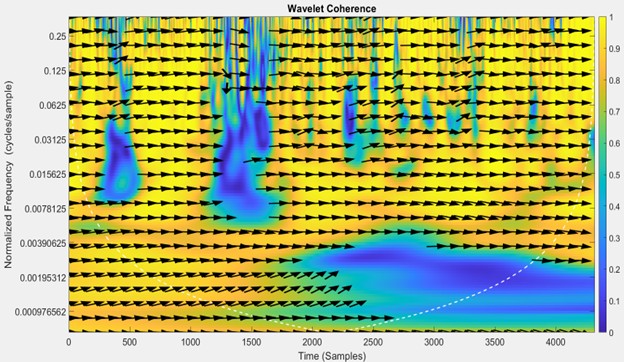
Fig. 6 – Wavelet correlation between the North (Hx) components of the USA and NGK observatories.
- Implementation of web-based content covering the physical and mathematical foundations of the geomagnetic field, sources of the geomagnetic field, determination of declination in airport areas, and geomagnetically induced currents (GIC) and their impact on critical infrastructure; this also includes developing course chapter content and integrating external links to explanatory videos from specialized websites.
- Development of new prediction methods using statistical-spectral numerical analysis, artificial intelligence, and machine learning for space weather and climate forecasting and prediction prototypes.
The MATLAB Wavelet Toolbox enables the interactive removal of noise from the signals under analysis, allowing for multiresolution and wavelet analyses. To this end, the toolbox includes algorithms for continuous and discrete wavelet analysis, wavelet packet analysis, multiresolution analysis, wavelet scattering, and other multiscale analyses.
Wavelet coherence, defined by the `wcoherence(x,y)` function in MATLAB, is a measure of the correlation between two real-valued 1D vector signals of equal length—x and y—in the time-frequency plane. Applicable to the analysis of non-stationary signals and utilizing the analytic Morlet wavelet, it can detect events such as geomagnetic field anomalies, change points, and transients.
The arrows in the “wcoherence” diagram indicate the phase relationship between the two signals at each point in time and frequency (or period).
The phase angle of the cross-spectrum is the same as the phase shift between the signals.
The direction of the arrows in regions of high coherence can help in understanding the phase relationship. For example, if the arrows point to the right, it indicates that the two signals are in phase (zero lag), whereas if they point to the left, it indicates an anti-phase relationship (a lag of half a cycle). A quarter-cycle lag in a signal at a specific frequency is indicated by an arrow pointing vertically. Consequently, an arrow pointing northeast (between the zero and quarter-cycle lag directions) corresponds to a lag of one-eighth of a cycle (half of a quarter-cycle); similarly, an arrow pointing northwest (between the quarter-cycle and half-cycle lag directions) corresponds to a lag of three-eighths of a cycle (adding half of a quarter-cycle to a quarter-cycle). The lags progress in a counter-clockwise direction. These strong correlations are also confirmed by Figures 3 and 6.
- Dissemination of results through published papers and conference participation.
Asimopolos Natalia-Silvia et al. 2024 – Analysis of the geomagnetic storm from March 23-24, 2024, which had a strong impact on the Earth BGS 2024, www.scopus.org, www.earthdoc.org
DOI: https://doi.org/10.3997/2214-4609.202149BGS42
Asimopolos Laurentiu et.al. 2024 – Analysis of geomagnetic databases impacting space weather, SGEM 2024, Space Technologies and planetary Science, https://www.sgem.org/, www.scopus.org, DOI: 10.5593/sgem2024/6.1/s28.63, ISBN : 978-619-7603-74-3, ISSN: 1314-2704,
Asimopolos Natalia-Silvia et. al. 2024 – Study on the strongest geomagnetic events in the current solar cycle, Studii şi comunicări. Ştiinţele Naturii. ISSN 1454-6914, indexed in Master Journal List, „B+” category, http://biozoojournals.ro/Muzeul Olteniei Craiova. Oltenia, Studii şi comunicări. Ştiinţele Naturii. ISSN 1454-6914, Tom 40, nr. 2/2024, pag 7-12
Asimopolos Natalia-Silvia et. al. 2025 – IMPLEMENTATION OF THE GEOMAGNETISM WEB PLATFORM IN THE GEOLOGICAL INSTITUTE OF ROMANIA WEB DOMAIN, SGEM2025, Section Education, Training, and Capacity Building in GeoSciences; Innovative Educational Approaches in GeoSciences, www.scopus.org
Asimopolos Laurentiu et.al. 2025 – CONSIDERATIONS REGARDING THE EVALUATION OF THE VARIABILITY OF THE GEOMAGNETIC FIELD, SGEM2025, Section Space Technologies and Planetary Exploration. Space Mining; Use of Space Technology for Environmental Monitoring on Earth, , www.scopus.org
Asimopolos Laurentiu et.al. 2025 – The design of a web site with studies of geomagnetism – Studii şi comunicări. Ştiinţele Naturii. ISSN 1454-6914, indexed in Master Journal List, „B+” category, http://biozoojournals.ro/Muzeul Olteniei Craiova. Oltenia, Studii şi comunicări. Ştiinţele Naturii. ISSN 1454-6914 (in print)
Asimopolos Natalia-Silvia et.al. 2025 – The numerical analysis applied in the evaluation of geomagnetic activity Studii şi comunicări. Ştiinţele Naturii. ISSN 1454-6914, indexed in Master Journal List, „B+” category, http://biozoojournals.ro/Muzeul Olteniei Craiova. Oltenia, Studii şi comunicări. Ştiinţele Naturii. ISSN 1454-6914 (in print)